Here comes my personal wish list. Note that I intend to start working on an async-based rewrite of PyUAVCAN once the spec draft is finished.
Multi-node concurrent configuration tool
Many nodes, such as motor controllers, often require identical configuration to be shared across multiple devices. Shared configuration parameters are a subset of all parameters available on nodes; for example, uavcan.node_id will have to be unique, whereas motor_resistance are likely to be the same for all controllers.
Some parameters may have to be distributed across heterogeneous node sets, such as CAN bus bit rate.
The GUI tool should allow the user to batch-reconfigure an arbitrary set of nodes on the bus. Probably this should be arranged like some sort of table, where columns are nodes, and rows are configuration parameters:
| Parameter name |
12 |
42 |
123 |
param_a |
1 |
2 |
<N/A> |
param_b |
12.34 |
-2.45 |
100500 |
param_c |
<N/A> |
1, 2 |
2, 89 |
Parameter import/export
It should be possible to load/store configuration parameters to/from a node (or multiple nodes, as above) from/to file on disk.
Computational graph display with statistics
Quote from PR:
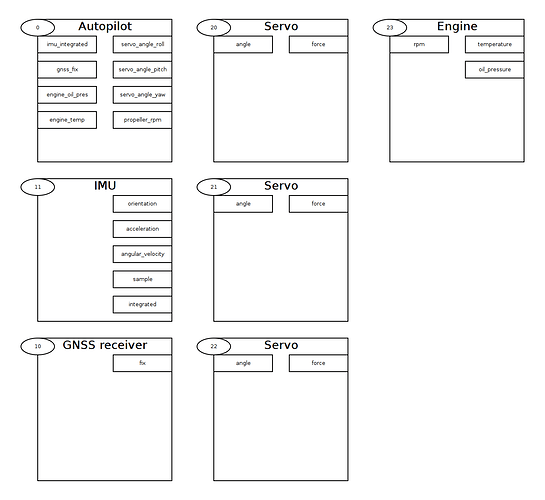
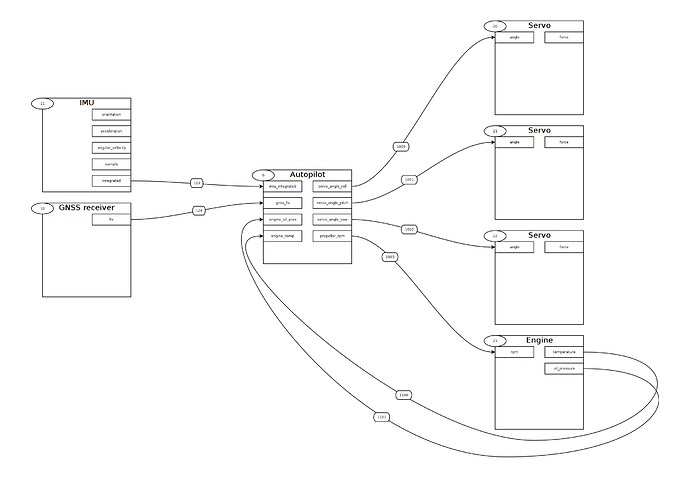
uavcan.node.GetPorts, uavcan.node.GetPortInfo, uavcan.node.GetPortStatistics - these data types provide a simple yet very powerful API that allows one to reconstruct the computational graph, collect the main communication metrics (input/output/errors) in real time, and verify that all nodes use compatible data types for communication with each other. Eventually, when the new GUI tool is around, it will be able to build things like this, showing the traffic intensity and transport errors in real time:
Bus monitor with logging
The existing bus monitor seems to have most of the required functionality. What is missing is the ability to log data (raw CAN frames with timestamps) to a file. For the file format, I suggest we use Popcop frame format, like HDLC – it is very simple, offers a transparent channel, and uses a strong CRC32C algorithm.
Logging to a file from the browser might be impossible though, so this functionality may need to be implemented on the server and controlled remotely from the browser with the ability to download the log file when completed.
Log file analysis
I haven’t given much thought to this idea yet, this is a highly complex feature which probably shouldn’t be implemented in the first edition of the tool. What follows is a highly disorganized collection of random ideas.
Ideally I would like to be able to load a frame dump file (which contains only timestamped CAN frames; or, well, not necessarily CAN, but we don’t support other protocols yet) recorded either by the tool itself or by a third-party hardware (which is why it is important to agree on a particular format beforehand), and let the tool perform an in-depth analysis of the state of the bus at any given moment in time, with a convenient overview of important events that were happening on the bus for the duration of the log file.
For example, suppose we have an hour long data dump from a black box flight recorder (which is stupid and all it does is just storing CAN frames on a flash disk with local monotonic timestamps). Having opened the recorded file, we should be able to see a brief event overview on a timeline, where important events are marked, such as: a new node appeared, a diagnostic message emitted, and so on, correlated with a bus load plot (so that we can see bus load abnormalities easily) and the system time (recovered from time sync messages correlated with the monotonic timestamps from the log file). There should be some kind of a cursor, which the user can slide across the timeline. Having positioned the cursor at a particular location, the user would get a sample of the current state of the bus at this exact moment of time: which nodes are online, what are their statuses, and so on. It should be possible to replay segments of the timeline to plot values and study the data exchanged over the bus during that segment. It should be possible to export parsed data from a particular subject to a CSV, or search for a particular data pattern on the bus (e.g. find the first occurence where abs(climb_rate) > 10). The tool should be able to automatically attempt to parse the entire data set and highlight sections where data could not be parsed, possibly indicating connectivity problems. Ideally it should be possible to correlate multiple dump files in the same analysis session, to support recordings from redundant transports. My wish list is very long but I perceive I should stop here.
At one point in the past I spent a lot of time working with the ROS logging system, you can find some info here for inspiration: http://wiki.ros.org/rqt_bag
Plotter
Supremely important for debugging. Nothing to add here, the feature is self-explanatory. I am generally okay with the plotter we have in the current GUI tool, except that its configuration interface is a bit clumsy and not so user-friendly, perhaps it could be improved.
Publishing tool
In the current GUI tool there is a “ESC panel”, which works, but it’s created for a very specific, narrow use case. I think it should be possible to create a generic alternative which would allow the user to publish arbitrary messages or invoke arbitrary services by providing a dynamically-constructed GUI based on the DSDL definition of the data type in use. That would be great to have, doesn’t seem very hard to implement.
Other features available in the current GUI tool
This includes the log viewer, dynamic node ID allocator, and the file server (the last two are implemented in PyUAVCAN). The file server is required for firmware updates.


