My humble opinion is that things like Electron and VSCode come and go, whereas standalone web apps seem more dependable in the long term.
Fair enough but I think the two are a bit different. Electron is an application framework that is simply more full-featured and higher-level then our proposed flask/vu.js framework. VSCode is something that can fall out of favor which would affect us.
So “Which re-raises the question: should this be an Electron application?”
@scottdixon I also think Electron maybe is a better choose for us.
Yeah. I think we could build something like this:
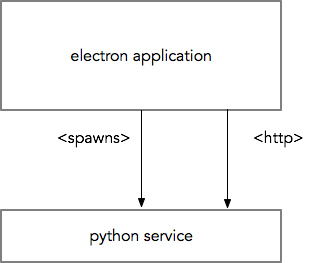
Where we could also allow UI remoting by skipping the spawning of the local process and connecting to an existing python service:
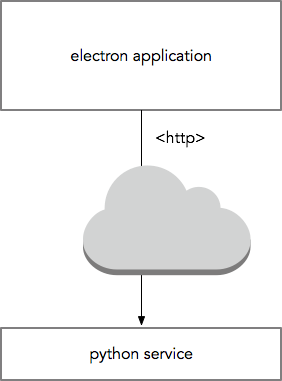
This also suggests a nice separation of work:
- Front-end - We can have one person concentrate on just the nodejs front-end without needing to touch python.
- automation/service layer - We can have a person that concentrates on the python service API and command-line automation components.
- pyuavcan - the automation./service layer is built on pyuavcan so this is another interface layer we can separate concerns at.
We might even benefit from moving the automation service into its own project giving us:
Yukon - Javascript GUI
[automation project] - RESTful-HTTP and commandline automation on top of pyuavcan.
Pyuavcan - Python implementation of UAVCAN
Thoughts?
Exactly.
Although I would not suggest creating an electron app, just to launch the python service; a very small python layer that also serves the frontend at a standard browser, while also starting the daemon is sufficient.
Wireframes first, feature & usability discussion and then, we can start establishing some contracts for the rest api endpoints.
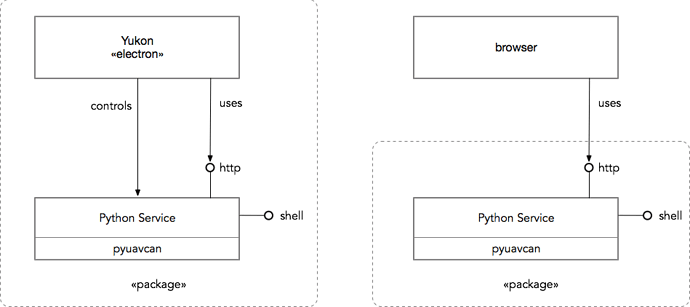
So I think we agree on this:
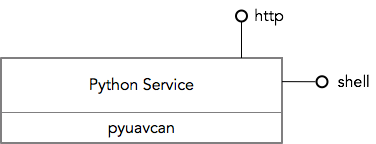
(If you don’t know UML, the circle on the end of a stick, or “lollipop” means “interface”)
But let’s take a moment to compare Electron versus simply serving the UI from the automation layer:
With Electron we get a framework that provides desktop GUI integration, packaging, updates (either automatic or push notification of availability) and a known, stable browser environment. The simplest user story for getting started is:
- Make sure you have Python3 installed.
- Download Yukon
- Open Yukon
If we don’t use Electron we still get packaging via PyPI but we no longer have a stable browser environment nor desktop integration. This adds a few steps:
- Make sure you have Python3 and pip installed.
- Make sure you have [insert browser requirements here]
- pip install Yukon
- start Yukon.
- Open your browser to localhost:[yukon port]
The latter isn’t the end of the world given that, if you know how to use pip you probably can handle this level of complexity. That said, we should consider the difficulty of diagnosing UI errors when you don’t control the browser. For the latter configuration we’ll have a class of bugs where the user reports “when I do x, y goes wrong” for which we’ll respond “we can’t reproduce this. What browser and operating system are you using? Do you have any weird extensions installed? How old is this browser? What other tabs do you have open?” (etc).
Thoughts on this @Zarkopafilis?
- We can use babel to ensure browser compatibility
- Some styling errors may occur on edge cases, but I don’t think that’s a problem, really
- Electron adds a 80+ MB (if I recall correctly) executable size, that’s really bad: It’s a browser that runs in a desktop environment after all.
- We can have a script that automates the installation – pip is not that easy to use really
- starting Yukon can fire up the default system browser as well as the python service and what not
- Packaging & updating is not really an issue: Updates in general should happen when someone NEEDS new features. If you want this to happen blazingly fast, we can serve the tool from a separate online server (which is always up to date), which communicates with the localhost (or any configured) address.
- The desktop environment is not really an issue. We now have service workers, good support for browser local storage and a variety of other APIs we can use on the browser (from file system to gyroscope access).
For sure, we will have a python service ontop of pyuavcan. We have to look into potential auto-generated cli from the endpoints, so this part gets automated (like many CLIs do – ex. Google APIs do this generation thing all the time)
Also: Use swagger for the rest api documentation
Here is an example of what degree of functional flexibility the panel framework should be capable of:
VESC is an open source ESC project which supports UAVCAN v0 since recently (based on libcanard). They made their own GUI tool which supports various protocols, including UAVCAN. Ideally, their developers should have been able to take Yukon and write a plugin on top of it as described by Scott instead of building their own UAVCAN GUI (support for other protocols would be outside of the scope of the plugin, of course).
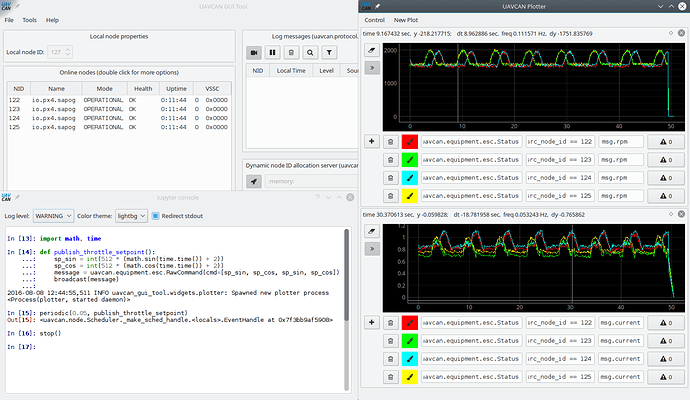
Here is another first-class use case which must be supported well:
In the video, a simple script (linked from the description) emits a particular ESC setpoint pattern, and the plotting engine collects and visualizes the data in real time. The data can be exported into CSV, too. Tagging @Zarkopafilis.
I will keep the plotter thing in mind, till the next feature which would probably be the plotter.
Regarding the panels, I’m unsure of what approach we need to take here. I can, for example, add a their party plugin section, which essentially scans some directory and adds this to the Vue’s router or the navbar. I don’t want to force everybody to use vue, so the second option could be preferable. The API is fully documented, thus, they can use it and even ship their own standalone UI or whatever.
Again, Keep in mind that multiple independent browser windows can exist, each with their separate state and lifecycle.
I will do some research for third party components and possible dynamic dsdl based UI generation.
Great. I am moving as fast as I can on my end to come up with a minimal working version of PyUAVCAN.
This should help: GitHub - OpenCyphal/pydsdl: Cyphal DSDL processing front end implemented in Python
There is no need to speedrun pyuavcan if that can backfire in the future (in terms of untested code / bac quality). Yukon can progress to a large extent with mock data, I’m even making the python stubs. Also, take in account that we are actively reworking the UI in parallel.
I don’t know if you guys have agreed on a strict deadline for v1.0 though.
Thank you for the resources.
wow. That video is truly terrifying.
I’m very interested in the extensibility of this UI. A primary use case for me is to support manufacturers shipping extensions to the UI with their DSDL definitions (e.g. Zubax can publish Myxa dsdl types and also provides a UI extension that lets you work directly with their ESC).
My original idea was to keep the Yukon UI in a single window for simplicity and because nobody really likes switching between a bunch of windows. I’m wondering if UI extensions are an exception to this rule to take advantage of the process separation between tabs/windows in browsers like Chrome?
3 posts were split to a new topic: Electron CAN from Octanis Instruments (moved from #229)
Here’s an additional case for the panel framework:
That servo comes with an installation guide:
I think I have an observation that may allow us to work out a sensible approach to architecting the UI/UX of Yukon.
Conceptually, the task of network diagnostics and monitoring, which we are attempting to solve with Yukon, amounts to defining specific data handling behaviors whose end result is acceptance of inputs and/or emission of outputs in a human-friendly format. By abstracting over the specifics of the input and output, one can trivially generalize over general data processing functions performed by regular UAVCAN nodes, such as sensors, actuators, and controllers, with the crucial difference that the data representations operated upon by the applications executed on the latter types of nodes are not optimized for direct production or consumption by a human.
For example, suppose that the user desires to evaluate the performance of a particular control loop distributed via the UAVCAN network. The user would emit a sequence of setpoint values and collect measurements that are representative of the state and performance of the loop. Emission of setpoint values could be done by obtaining a sequence of predefined values from user-provided storage, such as a CSV file, or by directly manipulating a GUI control such as a slider. Evaluation of the collected measurements could be done by charting or otherwise displaying them in real-time.
The key difference between the outlined evaluation scenario and a real production application is that in the latter case, process inputs are grounded at sensor feeds and process outputs are terminated at actuator setpoints instead of GUI elements. One could apply identical approaches to defining the necessary processing logic, but it might be suboptimal due to the different requirements to the resulting implementations:
- Production applications require robustness and determinism. Flexibility is rarely a concern.
- Diagnostics and monitoring logic should be easy to define and update by the user in real-time, during the diagnostics session. Unexpected behaviors and non-real-time performance are rarely an issue.
In a conventional UI, data handling logic, inputs, and outputs are specified by manipulating different standard GUI elements distributed across different parts of the application. For example, the old UAVCAN GUI Tool is equipped with separate specialized widgets for subscription to subjects (the Subscriber Tool), publication of specific message types (the ESC Panel), separate windows for plotting (the Plotter Tool), and so on. Similarities can be seen in the rqt suite for ROS, its predecessor ROS GUI, and in various other diagnostic tools like CANopen Magic.
The mapping between the many GUI elements and the analyzed dataflows has to be kept in the user’s imagination, which works well for us pub/sub nerds and in simple cases but breaks in complex applications, where the complexity threshold is dependent on the user’s prior experience with distributed computing. Further, complex data processing such as algebraic transformations, Fourier transforms, statistical analysis may be difficult or impossible to express using the conventional GUI toolkit, forcing the user to resort to unconventional UX patterns or even scripting. Certainly, a Python script or a Jupyter notebook with PyUAVCAN allows one to do whatever, but the mental model of the system required to write a script is often perceived as foreign by people who do not engineer software for a living (empirical observation).
(This is not to say that Jupyter+PyUAVCAN is useless; I am actually thinking to publish a very basic notebook as a form of a template for interactive diagnostics. Recent versions of Jupyter have built-in support for async that works just marvelously, allowing you to let the network stack run in the background while you’re tinkering with the notebook. I miss that asynchrony in the IPython console that is built into the old UAVCAN GUI tool.)
What seems to be needed is a UI solution that allows one to easily set up complex behaviors in real-time and that maps well onto convenient representations of the computational graph. It could be graphical programming, perhaps like LabView.
The many diverse features of the tool, such as the old ones implemented in the old UAVCAN GUI tool and the additional ones discussed in this thread earlier, are challenging to design a conventional UX around because of their complexity. The task almost solves itself if you remove the constraint of using conventional interaction patterns and replace typical GUI elements with a monolithic dataflow canvas that contains pictograms representing the nodes on the bus, visualization primitives such as plots and displays, input controls such as sliders, and data conversion and manipulation primitives such as subscribers, publishers, field setters/getters, and so on.
I am also quite certain that people who may not have a solid background in software engineering, such as a typical systems integrator or a technician, will find the canvas model far more approachable than this (especially the bottom-left part):
Also, much of the business requirements of the panel framework can be satisfied by providing the users with the ability to save and load canvas configurations to/from a file. We will get back to this later.
Apparently, the fundamental element of a dataflow model is data. Per the UAVCAN architecture, we have the following top-level entities:
- Message subjects.
- Service requests.
- Service responses.
Combined with the input/output segregation, they map onto the canvas model where a node is represented by a pictogram with the inputs on the left and outputs on the right. For subjects, inputs represent subscriptions, and outputs represent publications. For services, inputs and outputs always come in pairs. A pair where request is input and response is output represents a server, and the opposite represents a client.
    +===============================+
    |--------------+ +--------------|
--->| subscription | |  publication |--->
    |--------------+ +--------------|
    |-------------------------------|
--->| request   [server]   response |--->
    |-------------------------------|
    |-------------------------------|
--->| response   [client]   request |--->
    |-------------------------------|
    +===============================+
So far, this is identical to the graph view I described earlier; it is also assumed that the same auto-configuration semantics is built-in, such as when the user draws a new link or changes an existing link, it is translated into appropriate service responses emitted to the affected nodes. I will not be repeating the description here.
A node pictogram is an obvious place for displaying the basic information about the node: its health, mode, uptime, vendor-specific status code, version info, name, and so on – everything that can be obtained using the standard introspection types.
So far we have only one kind of data – the UAVCAN transfer links, that is, subjects and services. They form a good and intuitive model of the network, but they are not very convenient to operate upon, because their level of abstraction is too high for the task. The next kind of data we are going to need is a “DSDL object”, or maybe just an “object” for brevity. You get an object when you subscribe to a subject and get a new message from it, or when you receive a service response. More generically, an object is a particular data instance associated with a higher-level network link abstraction.
Data is to be converted between subjects/services and DSDL objects using subscribers, service clients, and service servers. The latter two are of the least interest because the major part of UAVCAN’s architecture are the subjects.
This is what a subscriber looks like:
    +===============================+
    |---------+            +--------|
--->| subject |            | object |--->
    |---------+            +--------|
    |              +----------------|
    |              | source node-ID |--->
    |              +----------------|
    |                    +----------|
    |                    | priority |--->
    |                    +----------|
    |                   +-----------|
    |                   | timestamp |--->
    |                   +-----------|
    |                    +----------|
    |                    |     etc. |--->
    |                    +----------|
    +===============================+
Transfer metadata fields are not listed in their entirety for reasons of brevity. A publisher is basically an inverse of the subscriber. A service client is similar but it’s slightly more convoluted:
    +========================================+
    |------------------+   +-----------------|
--->| service response |   | service request |--->
    |------------------+   +-----------------|
    |------------------+   +-----------------|
--->| request object   |   | response object |--->
    |------------------+   +-----------------|
    |----------------+                       |
--->| server node-ID |                       |
    |----------------+                       |
    |----------+                 +-----------|
--->| priority |                 | timestamp |--->
    |----------+                 +-----------|
    |------+                      +----------|
--->| etc. |                      |     etc. |--->
    |------+                      +----------|
    +========================================+
It is assumed that the execution flow is blocked until the response is received or timed out. We will get to error handling later.
A server would naturally be composed of two blocks – one receives the request, the other sends the response; the request processing is to take place between the two:
    +====================================+
    |-----------------+ +----------------|
--->| service request | | request object |--->
    |-----------------+ +----------------|
    |                   +----------------|
    |                   | client node-ID |--->
    |                   +----------------|
    |                      +-------------|
    |                      | transfer-ID |--->
    |                      +-------------|
    |                         +----------|
    |                         | priority |--->
    |                         +----------|
    |                        +-----------|
    |                        | timestamp |--->
    |                        +-----------|
    +====================================+

    +======================================+
    |-----------------+ +------------------|
--->| response object | | service response |--->
    |-----------------+ +------------------|
    |----------------+                     |
--->| client node-ID |                     |
    |----------------+                     |
    |-------------+                        |
--->| transfer-ID |                        |
    |-------------+                        |
    |----------+                           |
--->| priority |                           |
    |----------+                           |
    +======================================+
The client block could also be split, but I am questioning the utility of that change.
So far we have two categories of links: UAVCAN transfers of three kinds (subjects, requests, and responses) and DSDL objects. In order to be able to operate on the data, we need the third and last category: primitives. A primitive is a basic data entity of any type that can be used to define a DSDL field: an integer, a floating-point value, a boolean flag, arrays and unions thereof.
Remember the lengthy conversation about value extractors for the plotting tool of the new Yukon? That was our attempt to produce a data handling solution for the very specific task at hand. That is an okay solution, but it does not fit into the rest of the logic due to excessive specialization, which indicates that we were probably approaching the problem using the wrong mindset. The dataflow model I am describing here seems to offer a much simpler solution that also fits naturally.
The principle is straightforward: we get a value from a DSDL object using a new type of block that we’re going to call a “field getter”. The inverse function is a “field setter”.
    +===================+
    |--------+ +--------|
--->| object | | object |--->
    |--------+ +--------|
    |           +-------|
    |           | field |--->
    |           +-------|
    |           +-------|
    |           | field |--->
    |           +-------|
    |           +-------|
    |           | ...   |--->
    |           +-------|
    +===================+

    +===================+
    |--------+ +--------|
--->| object | | object |--->
    |--------+ +--------|
    |-------+           |
--->| field |           |
    |-------+           |
    |-------+           |
--->| field |           |
    |-------+           |
    |-------+           |
--->| ...   |           |
    |-------+           |
    +===================+
The object is present at the output and at the input to permit chaining. In a dataflow language, forking a data link maps to a separate execution flow, which is not always desirable.
The set of fields that are read or written is specified through block parametrization when it is added to the canvas. The type of the object is deduced automatically from the input link. Likewise, we will need a default DSDL object constructor node that takes no inputs and produces a zero-initialized object at the output.
It is implied that the links are strongly typed. An attempt to connect a float-valued output to an int-valued input should result in an error, so we are going to need a collection of conversion primitives which I am not going to describe in this high-level overview.
Above I mentioned error handling. The concept of algebraic types and optional values maps to the semantics of dataflow languages well, so whenever we encounter a block whose operation may fail, it is implied that the output is wrapped into the following DSDL object type:
@union
uavcan.primitive.Empty.1.0 error
OutputType success
Where OutputType is a placeholder for the actual type (sorry, we don’t have higher-order types in DSDL). For example, if we were instantiating a client block (see above) for uavcan.file.Read.1.0, the output terminal response object would have the following type:
@union
uavcan.primitive.Empty.1.0 error
uavcan.file.Read.1.0.Response success
In the event of a successful invocation, the union would contain the second field, otherwise the first one. The big idea is that we define the data primitives through DSDL.
This is where we arrive at the big question: how do we perform flow control? I recommend that we turn our gaze upon LabView, where, for example, an if block is modeled as a frame containing two pages, the page is selected based on the state of an input boolean link. For DSDL unions, a trivial generalization comes naturally, where for each field (variant) a dedicated page is assigned. Therefore, the output from the service call example above is to be handled by wrapping it into a union block, where one page would contain the error handling logic and the other one would be the business logic.
Modularity and code reuse can be supported by allowing the user to define custom blocks, each represented by a separate file. A custom block contains a nested canvas of its own and a set of well-specified input and output terminals. Since the resulting logical structure is grounded at the physical network, the actual physical nodes may appear only in the top-level canvas, which we may call a “network canvas” to indicate its special status.
Nested blocks can enable partial bootstrapping: having defined a few basic primitives that form the foundation, the rest of the language could be defined through a collection of standard blocks. One of such basic blocks would be an arbitrary code block (JS?), whose behavior is specified by defining a class implementing a particular interface. When the block is placed on the canvas, the class is instantiated. When the block is invoked, the state of the class is propagated by calling a specific method. A simpler pure function block (i.e., stateless) may also be useful for simpler scenarios, such as trivial arithmetic operations, trigonometry, etc.
Code blocks would allow power users to implement any desired functionality, escaping the limits of such an opinionated dataflow model. Blocks that are found generally useful could be added to the standard library so that other users who may be hesitant to get their hands dirty with low-level bit-twiddling could leverage them as well. This approach means that a very basic MVP could be released very quickly, and the standard library could be populated later based on the empirical data collected from real applications.
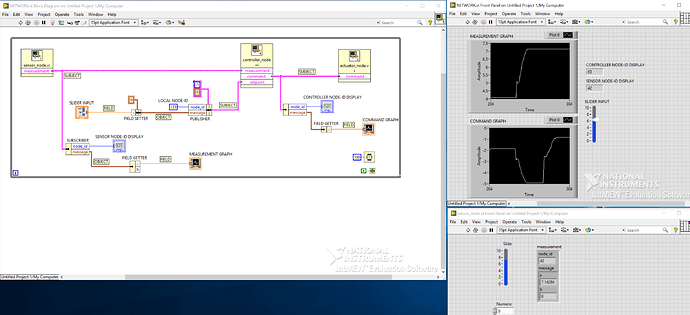
This is a quick mock-up I made in LabView (my license expired so I had to download an evaluation version from their website, it is valid for 45 days but runs only on Windows; people from NI told me that their Linux version does not have a license key verification so it’s not available for evaluation):
Source: network.zip (44.3 KB)
In the demo, nodes are represented by large yellow VIs (virtual instruments) at the top. The tool should remember the position of each node on the canvas, identifying each by its name (like org.uavcan.demo) and node-ID. When a new node appears whose position is not defined, the tool should find a free space on the canvas for it automatically. If there are anonymous nodes (they are manifested on the network as anonymous message publications coming from nowhere), a dedicated anonymous node block would appear on the canvas; unlike a standard node, this one would have no additional information. Once added, a node block cannot be removed; should the node go offline, its block would change state but stay on the canvas.
In the shown mockup, LabView has helpfully applied different colors to different categories of links:
- The thick pink lines are subjects.
- The thick brown lines are DSDL objects.
- Thin blue and orange lines are integer/float primitives.
LabView enforces separation between the interface (so-called “front panel”) and the logic. I don’t expect this approach to work well for our purposes; probably, the model used in Wolfram or Jupyter suits our needs better, where the logic and the user interface live in the same space. So that in the case of the demo above, the plot and the slider would appear on the canvas instead of a separate window.
Treating the canvas as part of the user interface also enables clever display paradigms such as animating the traffic load per subject/service, updating the error counters in real-time, and so on. The possibilities are huge. Anyway, I realize that I am just reinventing a SCADA here.
The canvas model can naturally incorporate almost the entirety of the functionality of the application. The remaining large components that we have discussed so far on the forum are:
- Global Register View – a large register table for bulk node configuration, discussed at length in the Yukon design megathread.
- Frame Monitor – transport-layer bus traffic analyzer, like in the old tool. Discussed in the megathread also.
-
Log DiggerCoroner – Ugh. I still don’t have a clear picture of this in mind. We should be able to find a common approach to real-time and postmortem analysis, where the canvas view looks and behaves almost the same when it’s used on a live network and on a log file. If we’re dealing with a log file, the user should be presented with a timeline that I described above. Considering that we are planning to coalesce bus inputs at the server-side instead of streaming data in real-time, we arrive at the obvious observation that the key difference between real-time analysis and log analysis is that in the latter case the data stream is terminated at the end of the log file, and in the former case the data stream is terminated at the present moment. If you squint at it this way, the only thing preventing complete generalization is that we can’t travel into the future. Anyway, this is a complex question and I would like to discuss it some other day. This post is about the canvas.
To enhance UI integration, we may need to extend the register schema with additional standard entries. At the time of this writing, we only have one standard register name – uavcan.node_id for the node-ID:
We should consider adding optional standard names to cover the following items:
-
Human-readable node name. We already have
uavcan.node.GetInfo.Response.namewhich is intended to describe the type of the node (the product name); the additional name would serve as a system-specific descriptor; e.g., “Pusher ESC”, “Left camera”, “Right seat yoke”. -
Favicon to display on the canvas. A register may not contain more than 256 bytes of data, which is a tad limiting for an image unless we agree that a 45x45 one-bit-per-pixel image is enough for everyone. Instead, a file convention like
/favicon.pngcould be introduced.
Yukon’s frontend needs to be an Electron application. Node.js by itself is too difficult to install and configure. Furthermore, without Electron we’ll have to build all the installers, push updaters, crash loggers, and other requirements for professional user applications ourselves. I have no desire to spend time reinventing that wheel. If the intrepid node.js developers that take-on the Yukon front-end want to maintain an optional “run from node” feature I have no objection but the primary use-case will be to distribute electron applications to the end user.
(moved from slack) I suggest that a node on the canvas should contain the following items:
-
Key identifiers: node-ID, node name (from GetInfo), node descriptor string (like “Left camera”), favicon.
-
Key items from the GetInfo response: hardware version; software version with the VCS hash and CRC.
-
Last received Heartbeat:
- Uptime in a human-readable representation (days, hours:minutes:seconds)
- Mode, health, vendor-specific status
-
Controls:
- View raw GetInfo response;
- View registers;
- Execute command (uavcan.node.ExecuteCommand) with shortcuts for standard commands such as reboot or firmware update.
-
Subscriptions/publications/clients/servers shown along the left/right edges as described above.
