The following is a direct copypasta of Nuno’s write-up. I wash my hands.
Tasklist
Backend
-
System and session mockup:
- Choose a specific language/data format to specify and describe the overall system. This includes nodes, subjects, pub/subs, data stream and buses;
- Create an example test that loads the system description, defined on the chosen format, on the backend. This test should be run manually. Addition to CI is an extra;
- Choose a specific language/data format to specify and describe the overall session. For simplification matters, it should be equal to the one used on the system description. This includes, but not limited to: timed interactions between nodes including service calls and simulated timeouts, failure injection, very-high bus load simulation, programmatic reactions to data payloads, seeded random data generation;
- Create an example test that loads the session description, defined on the chosen format, on the backend. This test should be run manually. Addition to CI is an extra;
- Choose a specific language/data format to specify and describe the overall system. This includes nodes, subjects, pub/subs, data stream and buses;
-
Code and functionality cleanup:
- Make sure that the overall functionality that previously existed makes sense, and if yes, make sure it works;
- Removed unrequired/untested/not functional code after the previous point validation;
- Verify and add/remove dependencies from the current source code.
Frontend
-
Code and functionality cleanup:
- Make sure that the overall functionality that previously existed makes sense, and if yes, make sure it works;
- Removed unrequired/untested/not functional code after the previous point validation;
- Verify and add/remove dependencies from the current source code.
-
Main window mock user-interface:
- Add a top bar that includes a mock search bar (simple HMTL/CSS search box);
- Add a right-side top-to-bottom bar with a similar aspect to a console/log output view;
- Add a left-side top-to-bottom bar with top-level utility items that are used to update the data-flow UI.
- Add button to load system description - for now this only allows to load the mock system description file;
- Add button to load session description - for now this only allows to load the mock session description file;
- Add button to load to reload the elements in the data-flow UI;
- Add button to clear the data-flow UI;
- Add a centered window canvas representing the data-flow UI;
-
Data-flow canvas area:
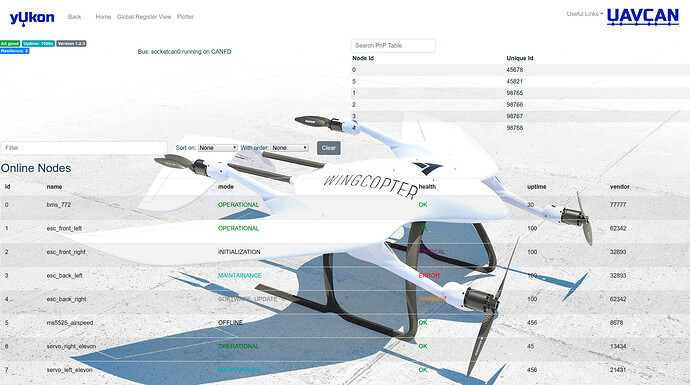
- Add a picture of a VTOL aircraft that serves as a background to UI;
- Add static node rectangle boxes to the following sensors/actuators. These should be placed over the background places where does components exist in the aircraft:
- One Airspeed sensor;
- One Flight Controller;
- Two servos;
- Four ESCs;
- One Battery Management System;
- Create the following (subject-related) logic connections between the following nodes, represented by a black arrow, from the publisher to the subscriber, when it’s a one-directional flow of data with respect to a specific subject, and a dual-sided blue arrow, when it’s a bi-directional flow of the same subject between two nodes:
- Airspeed sensor → Flight Controller, with the subject being Airspeed (Airspeed data type structure is WIP, no port ID);
- Battery Management System → Flight Controller, with the subject being BatteryStatus (no port ID);
- Flight Controller → Servos, with the subject being ServoCommand (ServoCommand data type structure is WIP, no port ID);
- Flight Controller → ESCs, with the subject being ESCCommand (ESCCommand data type structure is WIP, no port ID);
- Flight Controller ↔ all nodes, with subject being Heartbeat (port ID 32085);
- Make each rectangle draggable inside the data-flow canvas;
- This also means that the logic data-flow connections need to follow the node boxes, following the shortest path and not overlapping over the other node boxes;
- The following node information should be immediately visible in the box:
- Top: Node name and ID;
- Center: Node up-time;
- Bottom: Node health information and current operation mode.
- Add a button to each node box that when pressed, expands the box down with extra information. This might include, but not limited to: Node Software Image CRC, certificate of authenticity (COA).
Testing
- Testing with defined KPI’s:
- Establish KPIs (Key Performance Indicators) for Python/UDP/JavaScript data interchange. These KPIs shall be recorded as:
- Top-level numbers that can be asserted and are within range as part of the build.
- Graphs where additional information about available margins and other performance characteristics can be visualised.
- Implement tests that can be run manually in order to evaluate the KPI’s based on the mocked data being injected in the backend.
- Establish KPIs (Key Performance Indicators) for Python/UDP/JavaScript data interchange. These KPIs shall be recorded as:
