Suppose you have a Cyphal/CAN network where a certain malfunction took place. You have a full dump of the network traffic at the CAN frame level captured using some standard utility like candump. It would look like this:
(1667927497.533388) slcan0 1C7D5600#04C171
(1667927497.533422) slcan1 1C7D5600#04C171
(1667927497.533970) slcan0 107D5500#60030000000000E0
(1667927497.534081) slcan1 107D5500#60030000000000E0
(1667927498.529503) slcan0 107D5500#61030000000000E1
(1667927498.529547) slcan1 107D5500#61030000000000E1
(1667927499.530901) slcan0 107D5500#62030000000000E2
(1667927499.530947) slcan1 107D5500#62030000000000E2
(1667927500.529302) slcan0 107D5500#63030000000000E3
(1667927500.529346) slcan1 107D5500#63030000000000E3
(1667927501.529562) slcan0 107D5500#64030000000000E4
(1667927501.529606) slcan1 107D5500#64030000000000E4
(1667927502.205601) slcan1 0C60647D#020000E0
(1667927502.205618) slcan1 10606E7D#00000000000000A0
(1667927502.205624) slcan0 0C60647D#020000E0
(1667927502.205636) slcan0 10606E7D#00000000000000A0
(1667927502.206345) slcan1 10606E7D#0000C07F0000C000
(1667927502.206360) slcan1 10606E7D#7F0000C07F000020
(1667927502.206363) slcan1 10606E7D#0000792740
If you have a rough idea of when the fault occurred, it makes sense to isolate the relevant section of the log file by removing the traffic before & after the fragment of interest, but be sure to keep at least 10 seconds of data before the moment of interest (if possible) because it may contain valuable diagnostics. Then you install Yakut and set things up such that Yakut would use the log file as if it was a real network (the candump: prefix specifies the transport backend):
$ pip install yakut
$ export UAVCAN__CAN__IFACE='candump:/home/pavel/candump.log'
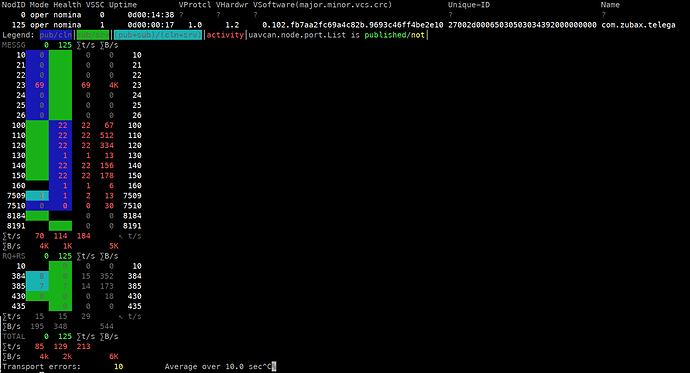
Now, using yakut monitor you can check the big picture:
$ y mon
This reveals the subjects and services available on the network around the time of the fault; take note of these. To proceed further you have to be aware of how the network was constructed; specifically, the purpose and data type of the available subjects needs to be known to make sense of the captured data. Suppose that in this case, the subjects are known to be mapped as follows:
| Subject | Subject-ID | Data type |
|---|---|---|
| ESC readiness | 10 | reg.udral.service.common.Readiness.0.1 |
| ESC setpoint_dyn | 21 | zubax.physics.dynamics.DoF3rd.0.1 |
| ESC setpoint_vel | 22 | reg.udral.service.actuator.common.sp.Vector31.0.1 |
| ESC setpoint_r_volt | 23 | zubax.telega.setpoint.Raw9x56.0.1 |
| ESC setpoint_r_torq | 24 | reg.udral.service.actuator.common.sp.Vector31.0.1 |
| ESC setpoint_r_volt_u9 | 25 | reg.udral.service.actuator.common.sp.Vector31.0.1 |
| ESC setpoint_r_torq_u9 | 26 | zubax.telega.setpoint.Raw9x56.0.1 |
| ESC feedback | 100 | reg.udral.service.actuator.common.Feedback.0.1 |
| ESC dynamics | 110 | zubax.physics.dynamics.DoF3rdTs.0.1 |
| ESC power | 120 | reg.udral.physics.electricity.PowerTs.0.1 |
| ESC status | 130 | reg.udral.service.actuator.common.Status.0.1 |
| ESC compact | 140 | zubax.telega.CompactFeedback.0.1 |
| ESC dq | 150 | zubax.telega.DQ.0.1 |
| ESC temp | 160 | zubax.telega.Temperatures.0.1 |
Decode messages from the subject of interest and save them as JSON:
$ y sub +M 23:reg.udral.service.actuator.common.sp.vector31 > 23.json
$ y sub +M 110:zubax.physics.dynamics.DoF3rdTs > 110.json
$ y sub +M 120:reg.udral.physics.electricity.powerts > 120.json
it is also possible to decode multiple subjects at once, either asynchronously or synchronously:
$ y sub +M 25:zubax.telega.setpoint.Raw9x56 110:zubax.physics.dynamics.DoF3rdTs 120:reg.udral.physics.electricity.PowerTs > mix.json
$ y sub 110:zubax.physics.dynamics.DoF3rdTs 120:reg.udral.physics.electricity.powerts --sync
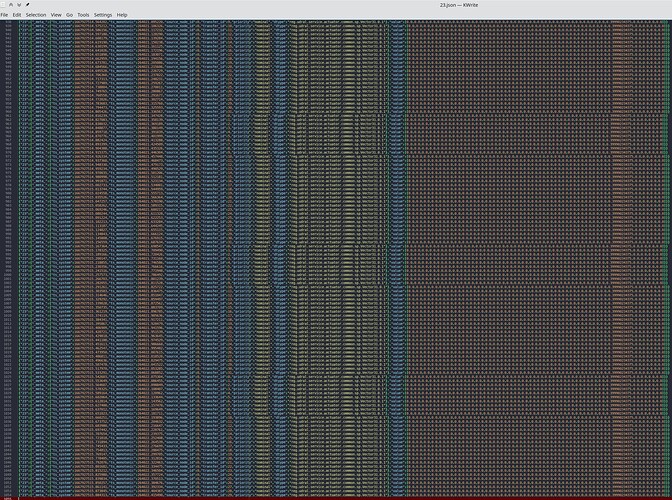
Example output for subject 23 (shown as image for compactness):
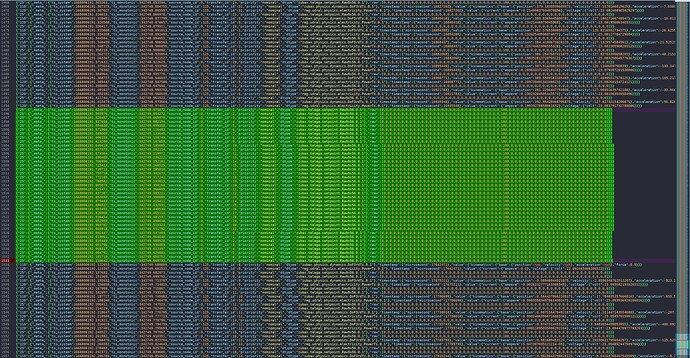
Same for subject 110; a timing anomaly is clearly visible here:
The adjacent topic 120 reveals that the timing anomaly is coincident with a sharp voltage increase:
{"120":{"_meta_":{"ts_system":1667927512.550158,"ts_monotonic":265571.450227,"source_node_id":125,"transfer_id":0,"priority":"nominal","dtype":"reg.udral.physics.electricity.PowerTs.0.1"},"timestamp":{"microsecond":0},"value":{"current":{"ampere":0.47502562403678894},"voltage":{"volt":20.76006317138672}}}}
{"120":{"_meta_":{"ts_system":1667927512.574356,"ts_monotonic":265571.474236,"source_node_id":125,"transfer_id":1,"priority":"nominal","dtype":"reg.udral.physics.electricity.PowerTs.0.1"},"timestamp":{"microsecond":0},"value":{"current":{"ampere":0.4647235870361328},"voltage":{"volt":20.760677337646484}}}}
{"120":{"_meta_":{"ts_system":1667927514.207053,"ts_monotonic":265573.107155,"source_node_id":125,"transfer_id":2,"priority":"nominal","dtype":"reg.udral.physics.electricity.PowerTs.0.1"},"timestamp":{"microsecond":0},"value":{"current":{"ampere":0.40117526054382324},"voltage":{"volt":24.518089294433594}}}}
{"120":{"_meta_":{"ts_system":1667927515.206336,"ts_monotonic":265574.106476,"source_node_id":125,"transfer_id":3,"priority":"nominal","dtype":"reg.udral.physics.electricity.PowerTs.0.1"},"timestamp":{"microsecond":0},"value":{"current":{"ampere":0.0},"voltage":{"volt":25.382097244262695}}}}
{"120":{"_meta_":{"ts_system":1667927515.247085,"ts_monotonic":265574.147190,"source_node_id":125,"transfer_id":4,"priority":"nominal","dtype":"reg.udral.physics.electricity.PowerTs.0.1"},"timestamp":{"microsecond":0},"value":{"current":{"ampere":0.0},"voltage":{"volt":25.38115882873535}}}}
It is also possible to plot the data using PlotJuggler. This is covered in the Yakut documentation (with examples).


